
Last updated September 23, 2026
Free visual inspection and a written scope of work before any mitigation begins - photos, moisture readings, and drying logs go in your claim file
The scope we write is the scope we bill. Anything new gets shown to you, in writing, before we touch it.




Damage Restoration Warning Signs: A Spring Valley Homeowner’s Reference Guide
A moisture reading above 16% in a stucco wall cavity registers on a pin meter two to six weeks before any surface staining appears. In Spring Valley, where slab-on-grade construction and synthetic stucco systems dominate neighborhoods built from the 1990s through the 2010s, that delay is expensive. The homeowner who waits for visible damage has already funded the mold colony, compromised the structural subfloor, and created a claim documentation gap that insurers scrutinize. This guide covers the instrument-detectable signals that precede visual damage in our specific construction environment, the reading thresholds that separate normal from critical, and the HVAC patterns that reveal leaks before drywall tells the story. For seasonal damage restoration care specific to Spring Valley, see our year-round homeowner’s guide.
Quick Answer
The earliest warning signs of water damage in a Spring Valley home are measurable, not visible: wood subfloor moisture above 14%, stucco pin readings above 16%, indoor relative humidity sustained above 60% without cooling load changes, and thermal imaging cold spots more than 8°F below adjacent surfaces. These indicators appear 2-6 weeks before staining, warping, or odor become apparent. Detecting them requires a pin-type moisture meter, a hygrometer, and knowledge of the baseline readings specific to our desert climate and slab construction.
Table of Contents
- Instrument-Detectable Signals That Precede Visible Damage
- Stucco Failure Patterns Unique to Spring Valley Construction
- Condensation Staining vs. Active Leak Staining on Interior Drywall
- HVAC-Related Warning Signs: Where Leaks Announce Themselves First
- Moisture Reading Reference Table by Material and Season
- Early Warning Signs for Mold, Fire, and Storm Damage
- Common Mistakes to Avoid
- When to Call a Professional
- Frequently Asked Questions
Instrument-Detectable Signals That Precede Visible Damage
Visible mold, buckled flooring, and musty odors are tertiary indicators. By the time they appear, the damage has progressed through primary and secondary stages that were detectable with basic tools. In Spring Valley’s construction stock, where slab-on-grade foundations and synthetic stucco exterior finish systems (EFS) are standard, this progression follows predictable patterns that reward early measurement.
The primary stage begins when a water source contacts building materials and moisture content rises above equilibrium. For wood-based materials in our climate, equilibrium moisture content (EMC) typically runs 6-9% in summer and 8-11% in winter due to indoor humidity management. A reading above 12% on a pin-type meter signals departure from equilibrium; above 14%, microbial growth becomes possible; above 16%, fungal colonization is probable within 48-72 hours at room temperature.
The secondary stage involves vapor pressure differential-driven migration. Water moves from high vapor pressure to low, which in a Spring Valley summer means from the hot exterior toward the air-conditioned interior. This migration path follows framing members and insulation voids, creating measurable cold spots on thermal imaging before any surface change. We regularly document 10-15°F differentials at stud locations in homes where the owner reports “no visible problem.”
Three instrument checks every Spring Valley homeowner should perform quarterly:
- Pin-meter baseline readings at known-dry locations. Establish your home’s normal by testing an interior closet wall, a cabinet toe-kick, and an upper floor joist bay if accessible. Record these seasonally. When a suspect reading appears, you have comparison data.
- Thermal imaging scan of exterior walls and ceiling penetrations. Affordable FLIR attachments for smartphones now resolve 0.1°F differences. Scan on a hot afternoon with cooling running; cold spots at framing or penetration points indicate insulation displacement by moisture or air leakage carrying moisture.
- Hygrometer logging in mechanical spaces and low-airflow areas. The water heater closet, the HVAC return plenum, and the laundry room are early detection points. Sustained relative humidity above 55% without an obvious source (drying laundry, recent shower) indicates a concealed moisture load.
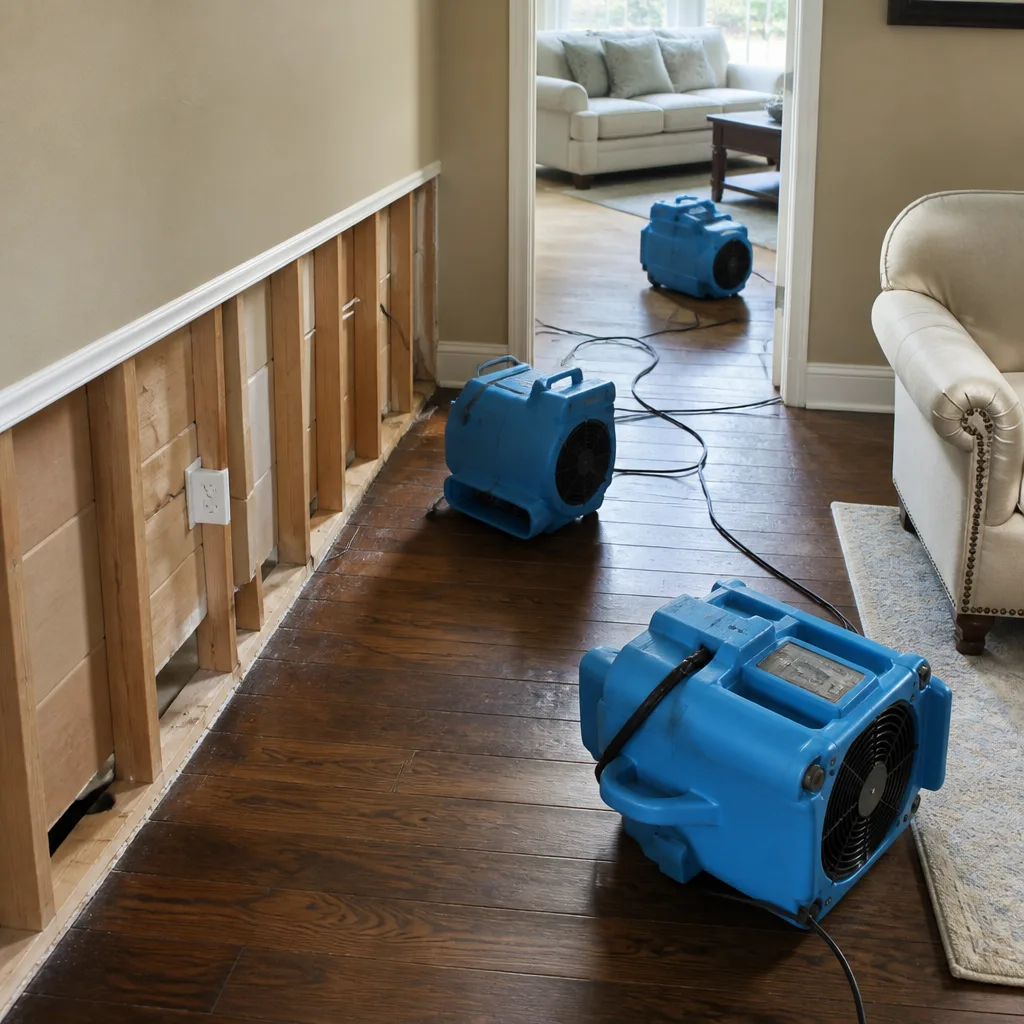
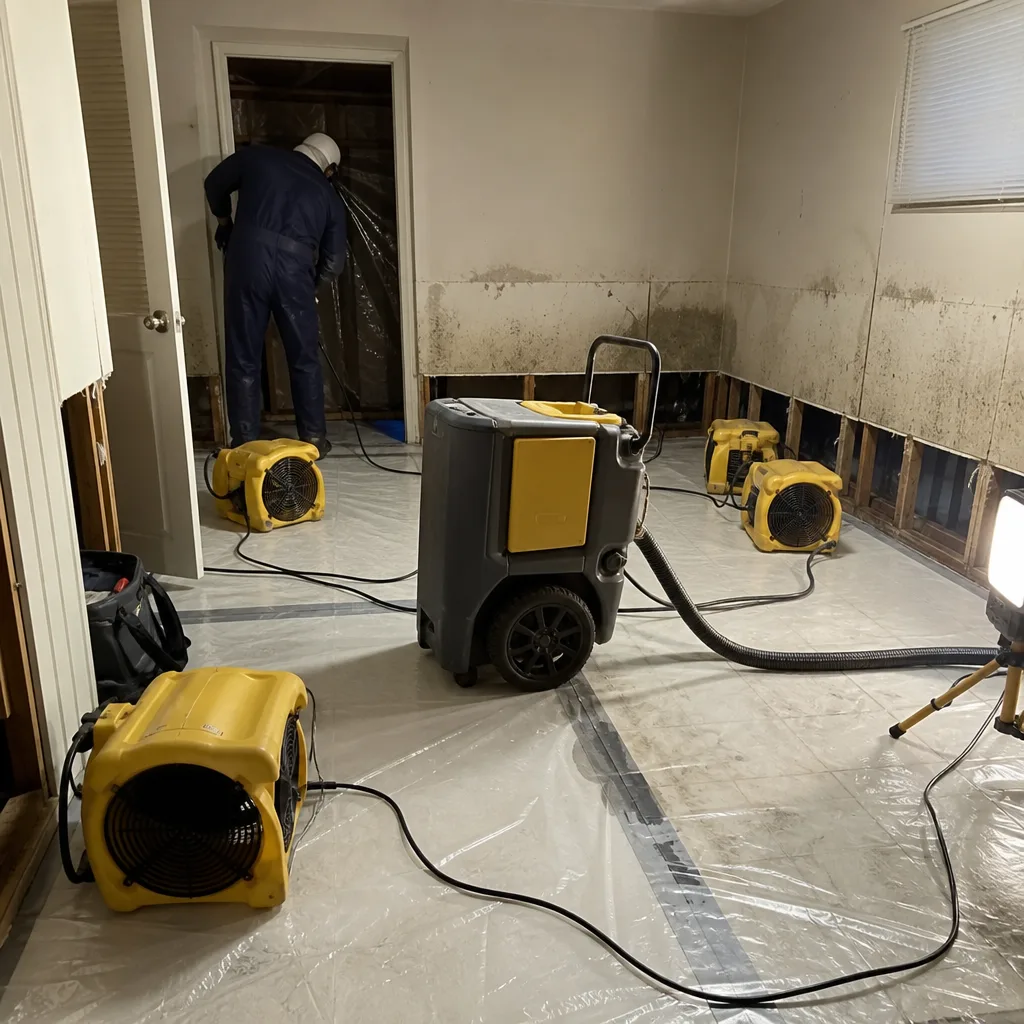
Psychrometric data, the measurement of air temperature and moisture content relationships, tells the rest of the story. When we deploy professional-grade drying systems from Dri-Eaz and Phoenix on a Spring Valley job, the daily drying log tracks specific humidity (grains of moisture per pound of dry air) and vapor pressure differential. A homeowner with a $30 hygrometer and a notebook can approximate this: if specific humidity rises 2-3 grains without a corresponding temperature drop or occupant activity change, water is entering the building envelope from somewhere.
We documented this pattern in a 2006-built home near Desert Breeze Park in Spring Valley. The owner noticed no visible damage. Quarterly pin readings at a kitchen cabinet toe-kick showed 11% in March, 13% in June, 18% in September. Thermal imaging revealed a 12°F cold spot at the dishwasher supply penetration. The slab had a 3-foot hairline crack beneath the cabinet, wicking irrigation water from a misaligned planter bed. Repair cost at instrument detection: $1,400. Projected cost at visible damage: $8,000-$12,000 including cabinet replacement, subfloor drying, and mold remediation. This case illustrates why our DIY vs Professional Damage Restoration guide for Spring Valley homeowners recommends professional assessment for hidden moisture.
Stucco Failure Patterns Unique to Spring Valley Construction
Synthetic stucco, or Exterior Insulation and Finish System (EIFS), was installed on thousands of Spring Valley homes built between 1990 and 2010. The system performs well when detailed correctly, but installation variability and the thermal cycling of our desert climate create specific failure modes that produce directional moisture migration patterns.
Efflorescence, the white crystalline deposit of soluble salts, is the most visible stucco warning sign. Its location indicates the moisture path. Efflorescence at the base of walls suggests slab or foundation moisture wicking upward, common in homes with negative grading or failed perimeter drains. Efflorescence at window heads or sills indicates sealant failure at the rough opening, with water entering the drainage cavity and migrating to the exit point. Efflorescence in broad horizontal bands, typically 12-24 inches above grade, suggests a moisture barrier breach at the foundation-to-wall transition, often from termite inspection drilling or landscape anchor penetration.
In Spring Valley’s caliche-rich soils, foundation movement cracks the stucco base coat even when the structural slab remains sound. These cracks admit irrigation water during our brief but intense monsoon season, July through September. The water enters, dissolves salts from the cementitious base coat, and deposits them at the evaporation front. By the time efflorescence is visible, the OSB or gypsum sheathing behind the foam insulation has often been wet through multiple wet-dry cycles.
Directional indicators to read on your stucco:
- Vertical efflorescence streaks below penetrations: Active leak at penetration, likely sealant or flashing failure. Check hose bibs, light fixtures, and dryer vents.
- Horizontal efflorescence band at foundation: Negative grade, failed dampproofing, or irrigation overspray. Common in homes with automatic systems watering against the wall.
- Efflorescence at inside corners only: Collection point for water migrating from multiple directions, often indicating systemic drainage failure rather than single-point leak.
- Chalky, powdery surface without crystalline structure: UV degradation of the finish coat, not moisture-related. Distinguish by texture: efflorescence is crystalline and slightly abrasive; chalking is smooth and transfers to finger.
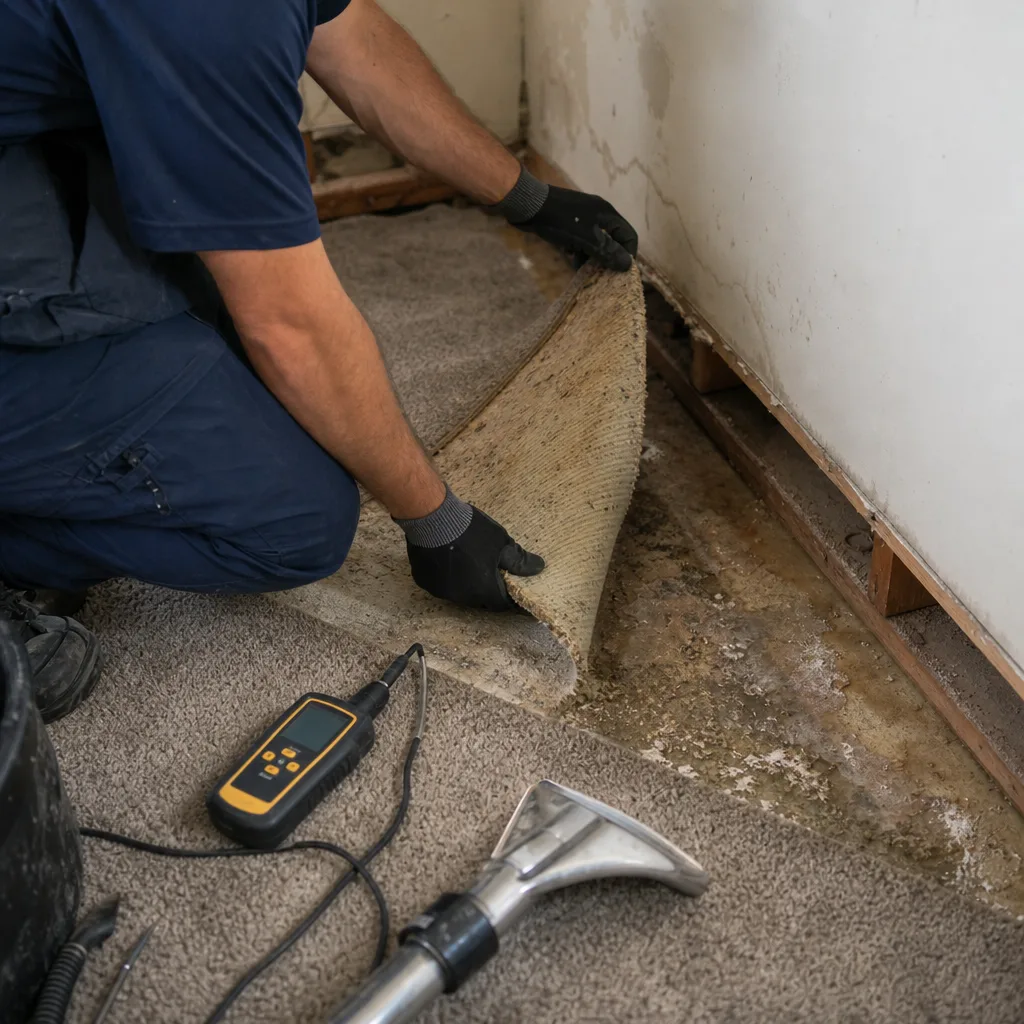
Pin-meter testing of stucco requires interpretation. A reading on the exterior surface measures the finish coat, which may read 8-12% in normal conditions due to atmospheric moisture exchange. The critical measurement is at the base coat or sheathing interface, accessible only through small probe holes or at damaged areas. We use insulated deep-wall probes on Phoenix brand moisture detection systems to reach this interface without surface damage. Readings above 16% at the interface indicate active moisture accumulation; above 20%, structural sheathing damage is likely.
The monsoon pattern in Spring Valley concentrates this risk in a narrow window. A single storm with wind-driven rain against a failed window seal can introduce 5-10 gallons into a wall cavity. Without drainage, that moisture remains through our dry fall and winter, feeding slow mold growth that becomes visible the following spring when temperature and humidity rise together.
Condensation Staining vs. Active Leak Staining on Interior Drywall
Not every water mark on drywall indicates an active leak. Misidentification leads to unnecessary wall demolition or, worse, ignored active leaks treated as “just condensation.” The distinction is measurable and pattern-based.
Condensation staining follows thermal bridging patterns. In Spring Valley homes, the most common condensation points are:
- Ceiling penetrations where attic insulation is displaced, creating a cold spot where humid interior air reaches dew point
- Exterior wall corners where two-dimensional heat flow creates the coldest surface in the room
- Floor-level drywall behind furniture against exterior walls, where air stagnation and surface temperature combine
Condensation stains are typically diffuse, light in color (yellow-brown rather than dark brown), and recur in the same pattern seasonally. They feel dry to touch even when fresh, because the moisture source is vapor, not liquid. A pin-meter reading of the drywall core behind a condensation stain typically shows 10-14%, slightly elevated but not critical.
Active leak staining is localized, dark, and often shows a drip pattern or horizontal spread line. The drywall feels soft or spongy. Pin readings at the stain center typically run 18-30% in active leaks, with a sharp gradient to normal readings within 6-12 inches. The moisture profile is the key: active leaks show a peak at the point of water entry, declining with distance; condensation shows a broad, flat profile across the thermal bridge area.
Field test protocol we use on Spring Valley inspections:
First, photograph the stain with a ruler for scale. Second, take pin readings at 2-inch intervals from stain center to 18 inches beyond visible damage, plotting the profile. Third, thermal image the area with a 10°F or greater temperature differential between interior and exterior. Active leaks often show a linear cold trace following a pipe or framing member; condensation shows a geometric pattern matching the thermal bridge.
The moisture reading range that separates condensation from active leak: below 15% at drywall core, likely condensation or historic event now dry; 15-18%, elevated but ambiguous, monitor weekly; above 18%, active moisture source requiring investigation. These thresholds assume standard 1/2-inch drywall at 70°F interior temperature. Adjust downward 2-3% for cooler basements or winter conditions.
In Spring Valley’s cooling-dominant climate, condensation is often misdiagnosed in summer when homeowners first notice ceiling spots. The instinct is to call a roofer, but the actual cause is frequently displaced attic insulation over a ceiling penetration, combined with thermostat setpoints in the low 70s and attic temperatures exceeding 140°F. The solution is insulation restoration and air sealing, not roof repair. A written scope before work begins, with moisture readings documented, prevents this misdiagnosis from becoming an unnecessary $4,000 roof claim.
HVAC-Related Warning Signs: Where Leaks Announce Themselves First

The HVAC system is frequently the first place an active leak announces itself in a Spring Valley home. Our cooling-dominant load, extended shoulder seasons with intermittent operation, and common installation practices create specific failure modes that produce warning signs before any wall or ceiling damage appears.
Drain pan backup: The primary condensate drain from the evaporator coil can clog with algae, dust, or construction debris. When it does, the backup drain pan beneath the air handler collects water. Most installations include a float switch to shut the system down before overflow, but switches fail or are bypassed by technicians prioritizing cooling continuity. The warning sign is water in the secondary pan, visible during routine filter changes, or rust staining on the cabinet base. In attic installations, common in two-story Spring Valley homes, the first visible indicator may be a ceiling stain directly below the air handler, but the pan water precedes this by days or weeks.
Coil frost and subsequent melt: Restricted airflow from dirty filters, closed registers, or duct leakage causes evaporator coil temperatures to drop below freezing. Ice builds, then melts during the off cycle or when the restriction is removed. The melt volume exceeds drain capacity, producing overflow. Warning signs include reduced airflow at registers, visible frost on refrigerant lines at the air handler, and water around the unit base that appears after the system cycles off. The moisture pattern is intermittent and correlates with system operation, distinguishing it from plumbing leaks.
Duct condensation in unconditioned spaces: Spring Valley attic temperatures reach 130-150°F in summer. When cool, dehumidified supply air passes through poorly insulated ducts, the exterior surface reaches dew point and sweats. This moisture drips onto ceiling drywall, producing stains that mimic roof leaks. The warning sign is stains aligned with duct runs rather than roof penetrations, and the absence of attic moisture on rafters or decking. Thermal imaging from the attic side shows cold duct lines with adjacent wet insulation.
Humidity baseline shifts: A properly sized and functioning cooling system in Spring Valley should maintain indoor relative humidity of 45-55% during continuous operation. If your hygrometer shows sustained readings above 60% with normal thermostat settings and filter maintenance, the system is not dehumidifying effectively. Causes include oversized equipment (short-cycling without adequate moisture removal), low refrigerant charge (reduced coil temperature and run time), or duct leakage pulling humid attic air into the return. The moisture load from this malfunction creates conditions for secondary damage throughout the home, not just at the HVAC location.
We recommend quarterly inspection of the condensate drain line termination, typically at an exterior wall near ground level. A dry termination during summer cooling operation indicates blockage. A wet termination with water pooling at the foundation indicates possible drain line separation or positive pressure forcing condensate backward. Both conditions are documented in our inspection reports with photo records, per our standard on every visit.
The equipment we deploy for HVAC-related moisture investigation includes thermal imaging to trace duct temperature profiles, psychrometric meters to measure supply and return air conditions, and borescopes to inspect drain pan condition without cabinet disassembly. This documentation becomes part of the written scope delivered before any repair work begins, under Haven Standard, Clause 1.
Moisture Reading Reference Table by Material and Season
The following table provides baseline, elevated, and critical moisture content readings for common Spring Valley building materials. All values assume pin-type meter calibration to species or material standard, and interior conditions of 70-75°F. Adjust readings 10-15% downward for surface-type (non-penetrating) meters, which measure only the outermost layer.
| Material | Normal Range | Elevated (Investigate) | Critical (Active Damage Likely) | Spring Valley Notes |
|---|---|---|---|---|
| Wood subfloor (OSB, plywood) | 6-10% | 11-14% | 15%+ | Slab-on-grade homes read higher near perimeter; monsoon season elevates baseline 2-3% |
| Solid wood framing (Douglas fir) | 7-11% | 12-16% | 17%+ | Desert EMC runs lower than national averages; 12% in framing is unusual and warrants tracing |
| Gypsum drywall (1/2″) | 5-9% | 10-15% | 16%+ | Painted surfaces read 1-2% lower; test at electrical box or corner bead for core access |
| Concrete slab (at surface) | 3-5% | 6-8% | 9%+ | Caliche subgrade holds moisture; new construction reads high for 12-18 months |
| Stucco finish coat (exterior) | 6-12% | 13-16% | 17%+ | Monsoon exposure can spike readings temporarily; trend over 2+ weeks matters |
| Stucco base coat / sheathing interface | 8-12% | 13-16% | 17%+ | Requires deep probe; surface readings are misleading for this critical interface |
| Carpet / pad (over slab) | 6-10% | 11-15% | 16%+ | Pad acts as reservoir; surface dry with elevated pad is common in slab wicking |
Seasonal adjustments for Spring Valley:
- December-February: Heating season, low outdoor humidity. Normal ranges contract 1-2%. Elevated readings are more significant.
- March-May: Transition, windborne dust. Check HVAC filter loading as confounding factor for humidity shifts.
- June-September: Cooling season, monsoon peak. Baselines rise 2-3% due to cooling load and occasional wind-driven rain. Sustained elevation above adjusted critical threshold indicates active problem, not seasonal variation.
- October-November: Cooling taper, stable conditions. Ideal baseline establishment period.
Vapor pressure differential, the engine of moisture movement in building assemblies, deserves explanation. Warm air holds more moisture than cool air. When our 75°F interior air at 50% relative humidity contacts a 65°F surface (a thermal bridge, a cold water pipe, an under-insulated duct), the air at that interface reaches 100% relative humidity and deposits moisture. The greater the temperature difference and the higher the interior humidity, the more moisture deposits. This is why a home at 60% indoor humidity has far more condensation risk than the same home at 45%, even at identical thermostat settings. The moisture reading table above assumes controlled indoor humidity; uncontrolled spaces require downward adjustment of critical thresholds.
Early Warning Signs for Mold, Fire, and Storm Damage
Water damage is the most common precursor, but mold, fire, and storm damage each produce early signals that reward attention. In Spring Valley’s specific environment, these signals interact with our construction type and climate in predictable ways.
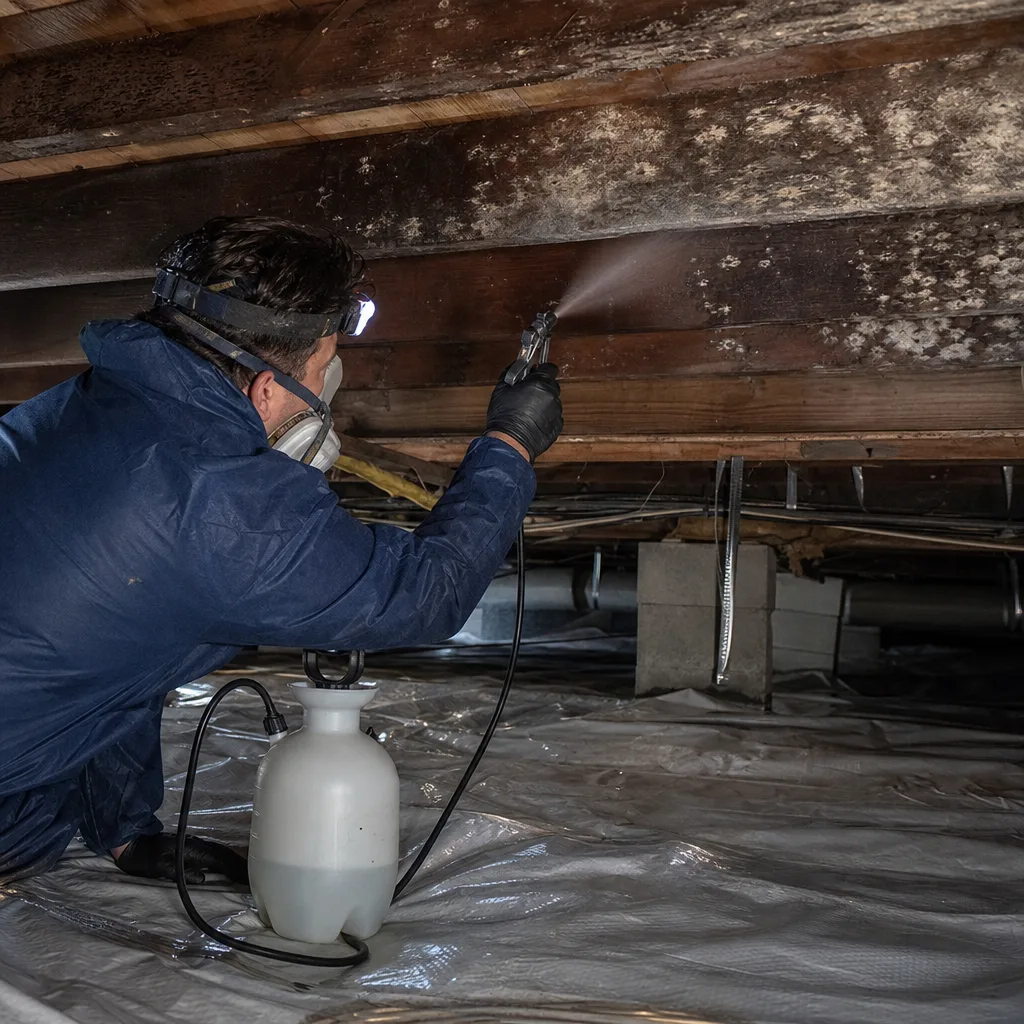
Mold damage: The earliest mold indicator is not visible growth but a measurable shift in volatile organic compound (VOC) output that affects air quality sensors. Consumer-grade VOC meters, $100-200, will show baseline elevation 1-2 weeks before visible colony formation. The specific pattern is a sustained rise without corresponding source introduction (cooking, cleaning, new furnishings). In Spring Valley homes with slab construction, mold risk concentrates at the wall-floor interface where slab moisture wicks into baseplate and drywall. We find this pattern repeatedly in homes with irrigation against the foundation, particularly in the older stock near Spring Mountain Road where lot sizes are smaller and planting beds crowd the structure.
Visible mold appears at 3-4 weeks of sustained moisture in our climate, faster in summer when temperatures accelerate growth. The first visible colonies are typically at the bottom of walls, behind furniture, or in closets with poor airflow. Color is not diagnostic: black mold (Stachybotrys) requires cellulose saturation and is less common in our dry climate than Aspergillus and Penicillium species, which appear green, white, or gray.
Fire and smoke damage: The warning signs here are often behavioral rather than structural. Electrical fire precursors include circuit breakers that trip repeatedly under normal load, outlets that are warm to touch, and a persistent ozone or fishy odor from overheating insulation. These signs precede visible flame damage by months or years. In Spring Valley’s housing stock, aluminum branch circuit wiring in homes built 1965-1973 requires particular attention; the oxide layer at connections creates resistance heating that progresses to fire. We document this during pre-loss inspections for insurance carriers, photographing panel condition and outlet temperature with infrared thermometers.
Post-fire smoke damage warning signs are more immediate: acidic soot residue that etches glass and metal within hours, and odor penetration into porous materials that becomes permanent after 72 hours without professional intervention. The urgency is documentation and stabilization, not cosmetic cleaning.
Storm damage: Spring Valley’s storm risk is concentrated in summer monsoon events with microburst winds and brief intense rainfall. Early warning signs on the structure include displaced ridge cap shingles visible from ground level, granule accumulation in gutters or at downspout exits, and loosened flashing at roof-wall intersections. These are pre-leak conditions that become active damage in the next storm. Post-event, interior ceiling inspection with a bright flashlight reveals water marks before they darken to visible stains; the fresh mark is translucent and yellow, darkening to brown over 48-72 hours as paper facing degrades.
We maintain live phone coverage 24 hours a day, 7 days a week for storm response, with no voicemail on emergency lines. The documentation protocol begins at first contact: photo record on every visit, written scope before work starts, daily moisture logs for drying operations. This documentation converts storm damage from an event into a claim with supporting evidence.
Common Mistakes to Avoid
- Waiting for visible damage before acting. In Spring Valley’s stucco and slab construction, visible damage represents 2-6 weeks of concealed progression. The cost multiplier between instrument-detected and visually apparent damage is typically 3-5x.
- Using a surface moisture meter as definitive. Non-penetrating meters read only the outermost 3/4 inch and are confounded by paint, wallpaper, and metallic substrates. They miss the elevated readings at sheathing and subfloor that pin meters capture. Use surface meters for screening only, pin meters for diagnosis.
- Attributing all ceiling stains to roof leaks. In our cooling-dominant climate, duct condensation and air handler overflow produce identical ceiling stains. Roof repair for an HVAC problem wastes money and leaves the moisture source active.
- Ignoring monsoon season efflorescence as “just salt.” Efflorescence is the visible residue of water movement. Its location indicates the breach point; its recurrence indicates ongoing water entry. Treat it as a directional indicator, not a cosmetic issue.
- Setting thermostat too low in summer. Each degree below 75°F increases condensation risk proportionally in under-insulated assemblies. The energy cost is minor compared to the remediation cost from condensation-driven mold.
- Failing to document baseline readings. Without knowing your home’s normal, you cannot recognize abnormal. A 15% subfloor reading is critical in December, merely elevated in August after monsoon exposure. Seasonal baselines resolve this ambiguity.
- Accepting verbal estimates for restoration work. Haven Standard, Clause 1 requires a written price before work begins, every time. Verbal estimates create scope-creep risk and documentation gaps that insurers exploit to reduce or deny claims.
When to Call a Professional
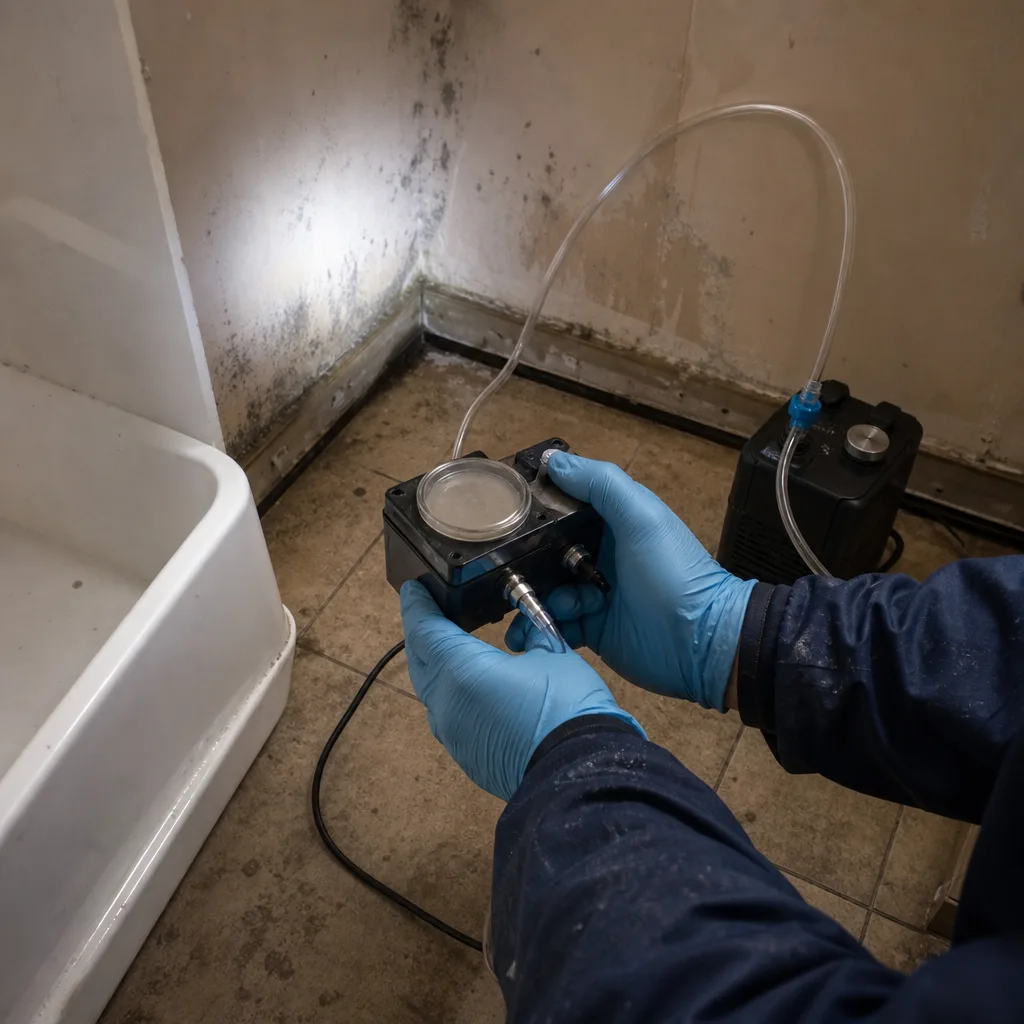
Call for professional assessment when moisture readings exceed critical thresholds in the reference table, when thermal imaging reveals cold spots greater than 8°F below adjacent surfaces, or when you detect musty odor without visible source. These conditions indicate concealed moisture that DIY investigation cannot fully characterize. For water damage restoration in Spring Valley, professional intervention includes psychrometric measurement, containment design, and documentation that supports insurance claims.
Specific scenarios requiring immediate response: active water flow that cannot be stopped at the source, sewage backup or category 3 water intrusion, electrical panel or outlet exposure to water, and any moisture condition in a home with immunocompromised occupants. In these cases, speed of documentation and stabilization matters as much as speed of water removal.
DryMark Restoration Spring Valley offers free estimates in Spring Valley. Our assessment includes pin-meter and thermal imaging survey, moisture reading documentation, and a written scope with price before any work begins, per Haven Standard, Clause 1. If you’re evaluating options, read How to Hire a Damage Restoration Contractor in Spring Valley: A Step-by-Step Guide first. Call (702) 430-2725 to schedule. We also provide a Free Second Opinion on any competitor’s written estimate at no charge.
Frequently Asked Questions
A professional moisture assessment with pin-meter survey, thermal imaging, and written documentation typically ranges $150-$300 in the Spring Valley market. DryMark Restoration Spring Valley applies this assessment fee toward any restoration work contracted. Call (702) 430-2725 for exact pricing for your property.
Most homeowner policies cover sudden and accidental water damage, including concealed damage discovered after the fact. Coverage disputes arise around maintenance-related gradual damage and documentation gaps. The photo record, moisture logs, and written scope we provide on every job are designed to close those gaps and present a claim in the format adjusters expect. We coordinate directly with adjusters when requested.
Live person answers every call, 24 hours a day, 7 days a week, with no voicemail on emergency lines. Dispatch timing depends on current call volume and your location within Spring Valley; we provide estimated arrival when you call. For active water flow or sewage backup, we prioritize based on health and safety risk, not call order alone.
Visible mold on a non-porous surface (tile, glass, metal) can often be cleaned with appropriate product and protection. Visible mold on porous materials (drywall, carpet, wood) indicates colony penetration that surface cleaning does not address. More critically, visible mold is typically the smaller portion of total colonization; the concealed growth behind and below is what drives health impact and structural damage. Professional assessment with air sampling and cavity inspection determines actual scope. We deliver a written scope with price before any work begins, so you can compare self-performed and professional options with full information.
Our daily drying logs document specific humidity, temperature, and moisture content at each affected material, recorded with equipment serial numbers and technician initials. This produces a time-stamped record of drying progress that correlates equipment deployment with material response. Adjusters recognize this format from large-loss commercial claims; it reduces questions and accelerates payment. Competitor documentation varies widely, from no written log to summary notes without readings. Ask to see a sample drying log before hiring any restoration company.
We coordinate directly with adjusters when you authorize it, providing the photo record, written scope, daily drying logs, and final moisture verification in the format their guidelines specify. This direct coordination is standard on our jobs, not an additional service. You remain the policyholder and decision-maker; we handle documentation and technical communication so you can focus on occupancy restoration.
Three factors: slab-on-grade construction eliminates the basement early warning system that homeowners in other regions rely on; synthetic stucco systems conceal wall cavity conditions until advanced damage; and our dry climate means evaporative drying at the surface can mask ongoing moisture accumulation at sheathing and subfloor. The homeowner who understands these factors and uses instrument detection is positioned to catch damage at the primary stage, before the cost multiplier kicks in.
The Bottom Line
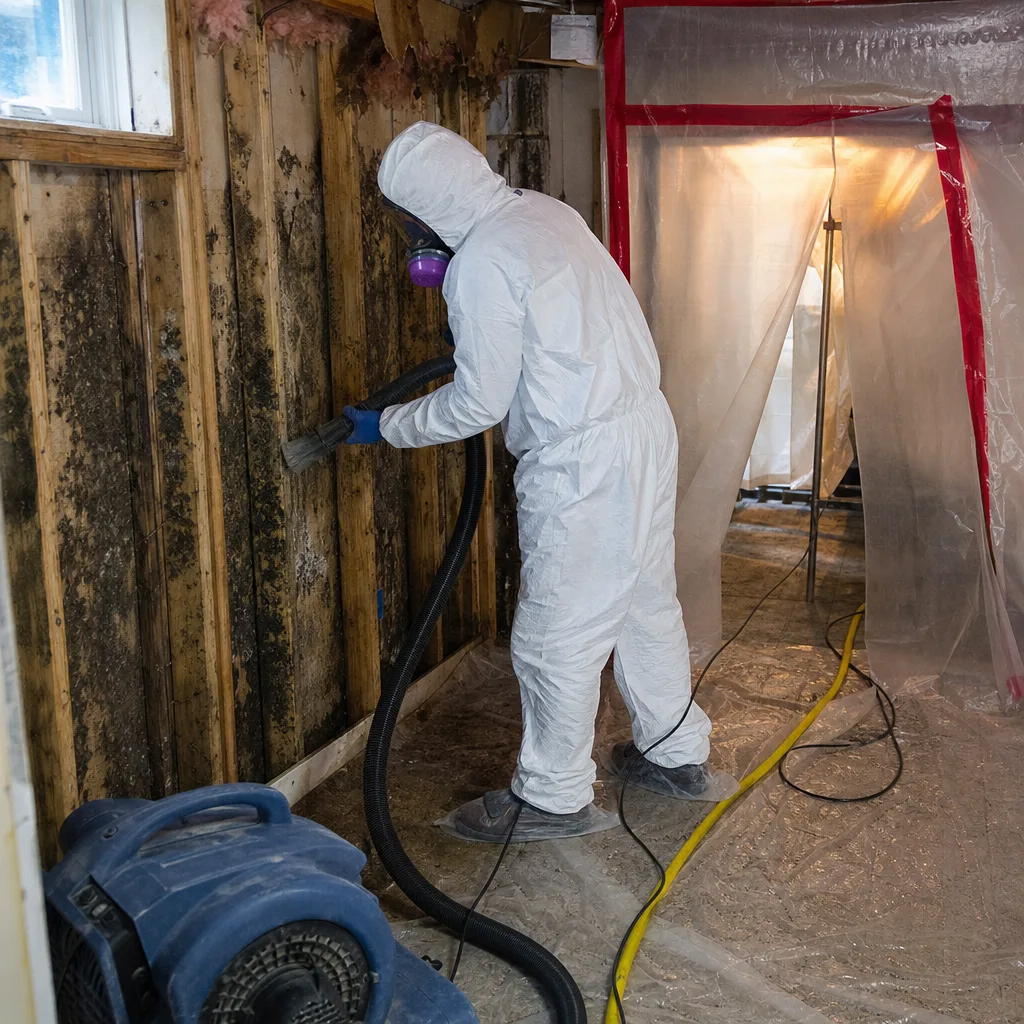
The warning signs that matter in Spring Valley are measurable weeks before they become visible. A pin meter reading of 16% in stucco sheathing, a thermal imaging cold spot of 12°F at a ceiling penetration, sustained indoor humidity above 60% without source: these are the primary indicators that precede mold, structural damage, and claim disputes. The construction type common to our area, slab-on-grade with synthetic stucco exterior, creates specific delay patterns that reward instrument-based monitoring and punish wait-and-see approaches. Establish your baselines now, inspect quarterly, and act on elevated readings before they reach critical thresholds. The documentation you create, or that we create for you with photo records and written scopes, is the difference between a paid claim and a contested one.
Written by Alicia Brennan, Owner at DryMark Restoration Spring Valley, serving Spring Valley since 2011.